ATV's TV aerial tests
Subject list :
- Aerial gain tests, how, why, where including :
- - Actual signal levels at the test site
- - Why peak gain figures are misleading
- - How accurate are these tests ?
- - The aerial height question
- The results, and notes on them including :
- - Typical original gain curve
- - Aerial group gain graph
- Tests of small Log Periodic aerials
- Aerial balun tests
- How many power stations are visible from 1140ft ?
- MUX Magician economy Tri Boom on test
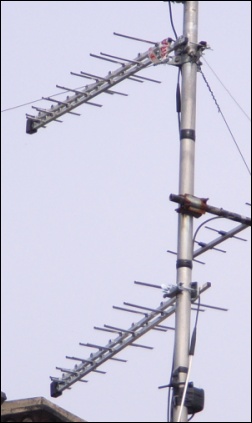
TV aerial gain tests
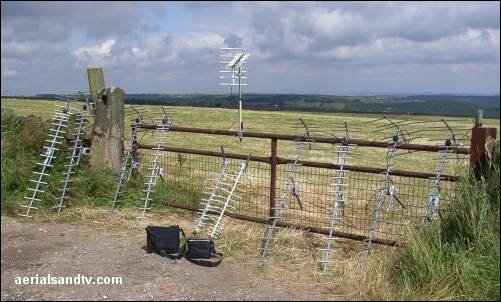
Aerial test site on the moors above Sheffield, at an altitude of around 345m (1140ft).
Now that’s what I call “line of sight”, and you can see for 40 or 50 miles !
Aerial testing : why it all started……..
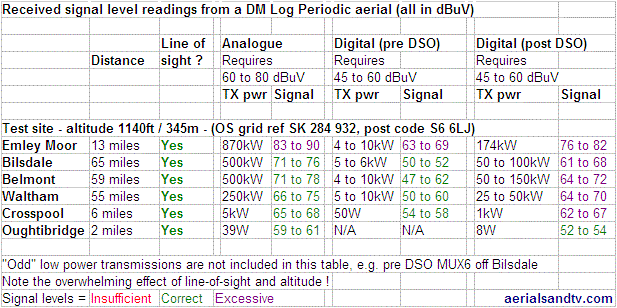
In summer 2007 I decided to institute a major new aerial testing programme and identified a site on the hills above Sheffield which would enable me to do this as it has “line of sight” off four main transmitters and two repeaters, namely Emley Moor, Oughtibridge, Bilsdale, Belmont, Waltham and Crosspool/Sheffield between them they cover virtually all the TV band frequencies. Just as important all of the transmitters are line of sight from the test site. Such are the signals available “line of sight” at 1140ft that even the DM Log gave/gives the signals shown in the table below. Bear in mind that the Yagi18s were giving up to 7dBμV more than that and the XB16s up to 9dBμV more, that’s NINE ! Just to put it in perspective, one should be aiming for 60dBμV (on digital), more than that and cross modulation interference can result.
The results of our tests were interesting to put it mildly, we rely on our own data now and more or less ignore manufacturers figures. This is particularly the case where they only give a (peak) gain reading. Even if the latter is accurate this figure can be misleading, especially with wideband aerials. What you really want is the gain graph, but many manufacturers won’t release this information, I wonder why?
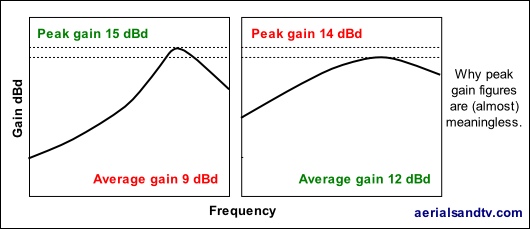
There are lies,
damn lies,
and peak aerial gain figures.....
We tested the aerials against each other at the same time, in the same location, and in actual reception conditions. We have also retested the same antennas and find the signal reception can vary for no apparent reason (possibly the temperature or humidity ? ) so our figures are based on more than one test and our own everyday experience.
Some of the most significant data concerned the response of grouped antennas above and below the designed for frequency band, this is particularly relevant for some transmissions which aren’t within the transmitter’s original (analogue) group. As an example it proves that a B group aerial (certainly the ones we sell ! ) will work perfectly well on CH 55, and not too bad on 56 either [see the relevant graph]. Crappy Contract aerials might not though !
At least two readings were taken - sometimes many more - on every frequency for every aerial (including many not published on this site), so some idea of the work involved can be imagined. I reckon I took around 8,000 individual readings, and that was just the 2007 tests ! Whilst it was very interesting to start with, it could became a hell of a grind !
But how accurate are these tests ?
Well, I can only say that when I’ve retested aerials, the results, when comparing similar types of aerial against each other, are pretty consistent, and not that much different from when I’ve tested the same aerials on the roof of our shop, a completely different location (and height off the ground). Furthermore, the results are actually more or less what you’d expect.
Interesting anecdote (incidentally proving the tests are accurate.....) : one of our major aerial suppliers only sells a B group version of its XB10. But when I tested it I told them it could just as well be sold as a K group, their response was we originally designed it as a B/K group but it was too complicated for many aerial installers to understand ! So we just sell it as a B group now....
The height question.....
Now, when these tests were first published some people said "they’re not valid because you’re testing aerials only 6ft from the ground". For various reasons (including the fact the results were more or less the same on our shop roof) I didn’t accept that argument, but I couldn’t prove I was right, until September 2011 !
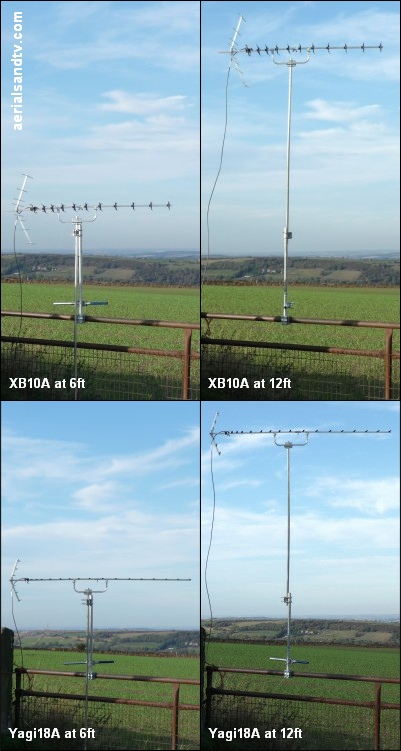
Whilst retesting a Yagi18A and a XB10A I decided to take a 2x2 bracket and a 6ft pole along so I could mount the test aerial on the latter and then slide it from 6ft to 12ft, and back again. I tested them against each other at 6ft, and again at 12ft, then, repeated the process to increase the accuracy.
It’s very important to understand the difference between the received signal at the two heights, and the difference in the received signal between the two aerials at those heights. The former obviously did vary, and by quite a bit, but the latter hardly varied at all, even less than I thought it might. On reflection this isn’t that surprising because testing similar aerials against each other at the same time, is the most accurate way to test comparative performance.
Note that the signal level on Belmont actually dropped as we raised the aerial, though it increased on Bilsdale, yet the difference in gain between the two aerials was still the same !
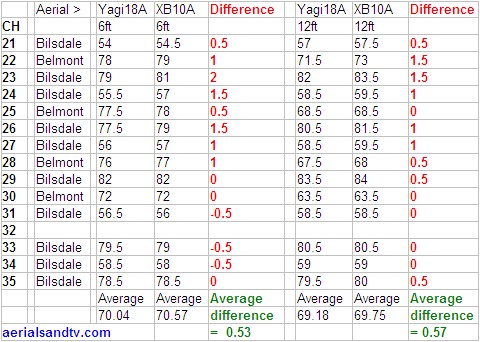
The difference of 0.04dB (between 0.57 and 0.53) is nothing. In fact most aerial test agencies will only guarantee an aerial gain figure to +/- 0.5dB. That’s 0.5, not 0.05.......
QED
The Results
In order to make the results comparable all readings are in dBuV and are all relative to a DM Log Periodic aerial. The latter has a pretty flat gain curve and thus is an ideal control antenna. Quite apart from anything else, wherever possible (i.e. in reasonable signal areas), Logs should be used as a matter of course, so the table(s) will show how much gain you have to make your decision on antenna choice. Note how the Log performs pretty well (in terms of gain) against small/medium wideband Yagis at the bottom of the band(s) but falls behind as the frequency rises. For those who are interested I reckon that, conservatively speaking, the gain of a DM log would be about 6 dB at the bottom of the band, then rising by about one dB in the middle, before dropping a little at the top end. These are the figures I used when calculating the absolute gain for the graphs. The absolute gain figures are conservative estimates, though they are accurate relative to each other. Remember that all aerial test readings are approximate anyway, as far as I’m aware no lab will even guarantee accuracy better than +/- 0.5dB, and relative to each other these test results (certainly for the average group gain figures) aren’t going to be much behind that.
Note results are dBd, gain compared to a half wave dipole, NOT the (dishonest ? ) dBi.
It should be noted that as antennas leave their designed for band their performance can become erratic and the further out of band you go the more pronounced this becomes. This can give spurious readings, particularly in a spot where multiple TXs can be received, because the aerials directivity can become very poor and inconsistent. This is the main reason why we have not published some readings (e.g. C/D off an A group) as they are meaningless.
Differences in the (full) test results of one dBμV on any individual frequency should be disregarded, manufacturing tolerances or a truck going over a hill somewhere between the test site and the TX could easily account for those ! Furthermore the response of any aerial is not linear, its gain curve will have bumps and dips in it. That said, a 1dB difference across the whole band is significant, and an increase (or decrease) of two or three dB is very significant. It should be remembered that 3dB is a 40% higher signal level, and such an increase at the aerial (as opposed to through an amplifier) is very difficult to achieve. Obviously if you live in a decent reception area these amounts of signal variation are not important, but if that’s the case, you should just use a Log Periodic anyway !
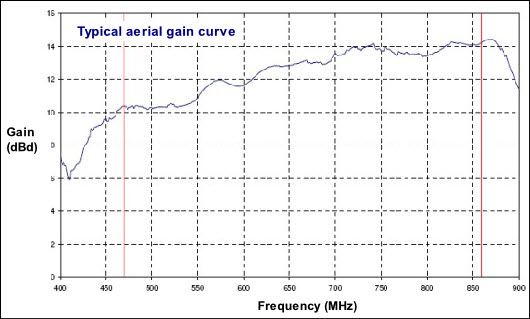
The gain curves are “smoothed off”, all (original) aerial gain curves have bumps and dips in them, but Contract aerials are generally the worst for this, particularly those without Baluns.
It should be borne in mind that gain is not everything, which is why Log Periodics are still one of the best aerials despite being having relatively low gain figures. Impulse noise rejection, directivity, out of band rejection, cross polar rejection and front to back ratio and can all have significant effects on the quality of the received signal. Having said that, gain is a function of the others (apart from impulse noise rejection) as it demonstrates that the antenna is performing efficiently. Indeed gain must be a function of the others. Why must ? Well an aerial is a passive device, the only way it can increase its gain in a particular direction is at the "expense" of gain in the other directions. As an aerial’s gain increases, its acceptance angle (and its cross polar rejection come to that) decrease. They must do, there is no other way for the aerial to increase its gain.
Finally, all of the above is before you even start talking about wind loading considerations and/or build quality. Fortunately, we definitely know what we’re talking about when it comes to the latter, there are no “Bacofoil” aerials here......
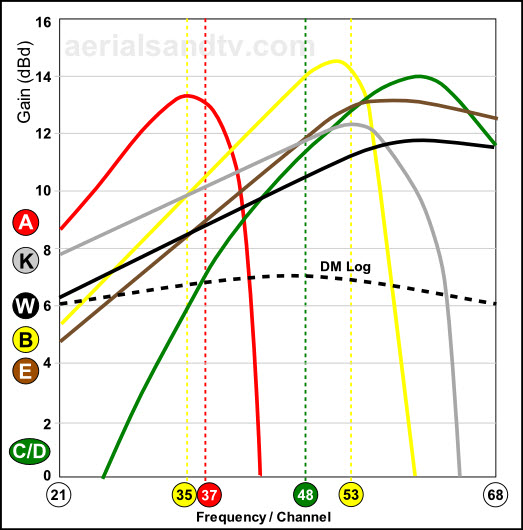

The adjoining table is a summary of the results, for the full results click here.
Also compare to :
A grp aerials - B grp aerials - C/D grp aerials - K grp aerials - E grp aerials - Wideband aerials
Aerial balun tests
When I say tests I’m afraid I just mean swapping baluns about between aerials (or omitting them) and seeing how much, if any, difference it makes……
Now, I knew that putting a balun in a DAB dipole cuts down the FM considerably, in fact that was the start of all my aerial testing back in April 2007. To be frank, compared to what I know now, I didn’t really know that much about aerials. I’d sold a DAB dipole to a chap who wanted DAB and FM. I assumed that because the frequencies were fairly similar it’d work for both. But the chap brought the aerial back saying the FM was rubbish (to be fair he wasn’t in the strongest signal area) and I can remember being stood in the shop thinking how can that be ? So, whilst he waited, I grabbed our spectrum analyser, connected it up to the DAB dipole, went up on our flat roof (in the pouring rain……) and “waved it about a bit” whilst checking the spectrum. Sure enough, not much FM, though our flat roof is fairly low down so I wasn’t 100% convinced either way. I swapped the the guy’s DAB dipole for a FM Half Wave and asked him to try that, he never came back so I assume it was all OK but I, on the other hand, was very far from OK.... My curiosity was positively burning, which led to all our FM/DAB tests, then TV aerial gain tests (on this page), then pole and bracket strength tests, the galvanising tests and the aerial positioning tests ! Anyway, the upshot was I learnt it was the balun in the DAB aerial which was filtering out much of the FM signal. To continue the story, years later, one of the companies which manufactures aerials for us accidentally put a load of DAB baluns in FM aerials, straight away I told them that would be a problem, and did some tests to prove it.
The summary of all my balun swapping / omitting is set out below :
FM folded dipole without an FM balun = loses about 2dB on FM but gains about 12dB on DAB
FM folded dipole with a DAB balun = loses about 7dB on FM but the DAB was no better !
DAB dipole with a UHF (B group) balun = loses about 9dB on DAB and 2dB on FM
UHF Contract 10C/D and Yagi10K without a balun = loses about 2dB (within the designed for group)
UHF Yagi 18A with a wideband balun (rather than an A group balun) = no significant difference *
* This test came about in April 2014 when the manufacturer of the Yagi18A announced they were no longer manufacturing A group baluns, they’d be fitting wideband baluns instead. I was concerned that might result in a drop off in gain so went and tested it. I was relieved to find that there was no significant difference.
Last but by no means least, in June 2020 I had a play about by testing aerials "back to back" one with a balun and one with the balun omitted, by using a simple "connector PCB" (as fitted to our FM aerials)*. Anyway I used a Contract 10C/D and a Yagi18K which together covered the band, though it must be said that the band only went up to CH56 at the time I did the test, and with a big gap between CH48 and the "temporary" MUX 7 and 8 on CHs 55 and 56..... The results are in the adjoining table (plus they have been retrospectively added to the summary above).
* These look like baluns but aren't, they're simply to allow connection of the cable to the dipole, and are used because it is impossible to fit an FM balun PCB (which are larger because the wavelengths are longer) inside a standard dipole connector box.
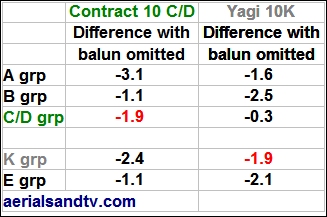
What is striking is that on average within the designed for group of the aerial (C/D for one and K for the other) the fall off in signal by omitting the balun is exactly the same : 1.9dB ! With only one test of two aerials (even with the apparent accuracy, the same to 0.1dB ! ) I'm not prepared to say that reduction applies to all aerials, though the saga of the folded FM dipole (mentioned above) reflects a similar fall off. That is to say the folded FM dipole without a balun is only about the same as an FM Half Wave when it should actually be a couple of dB up on it.
How many power stations can you see from 1140ft altitude ?
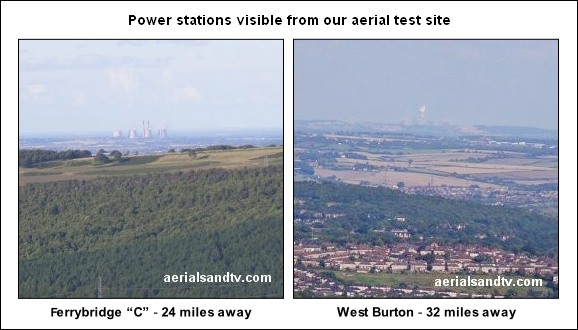
Belmont transmitter is just to the left of West Burton power station, but a further 26 miles away !
Such is the altitude (1140ft / 345m) at our aerial test site that at one time you could see an incredible 7 (seven ! ) power stations and these are marked with white pins on our TX map. Unfortunately, as of October 2021, that's now down to only three due to the cooling towers at Ferrybridge, Eggbrough, Thorpe Marsh and High Marnham having been demolished.....
From the NE to the SE they are/were :
Ferrybridge "C" (24m to the NNE, 2GW, open in 1966 to 2016) (5 C/towers demolished 2019 + 3 in 2022)
Eggborough (26m to the NE, 2GW, open from 1968 to 2018) (C/towers demolished 2021)
Drax (32m to the NE, 4GW, largest in Europe, opened in phases 1974 & 1986)
Thorpe Marsh (22m to the ENE, 1GW, open from 1963 to 1994) (C/towers demolished 2012)
West Burton (32m to the ESE, 2GW, opened in 1967 to 2023 - coal fired station closed)
Cottam (34m to the ESE, 2GW, open from 1969 to 2019)
High Marnham (36m to the ESE, 1GW, open from 1962 to 2003) (C/towers demolished 2012)
Incidentally I've been on trips round Drax and West Burton power stations, they were mind blowing !

