Aerial polar response diagrams
Subject list :
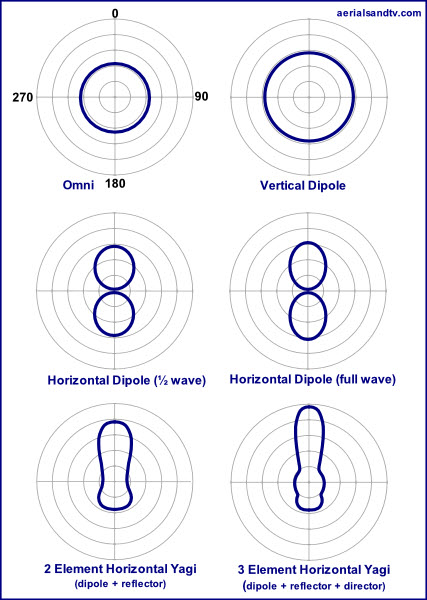
- Simple aerial polar diagrams
incl Omni, Half wave dipole, Full wave dipole, 2 and 3 element yagis
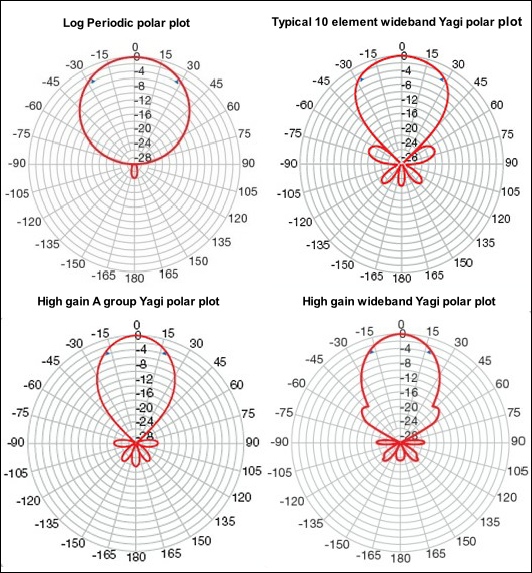
- Typical aerial polar diagrams
incl Log, Low gain wideband, High gain A grp and High gain wideband
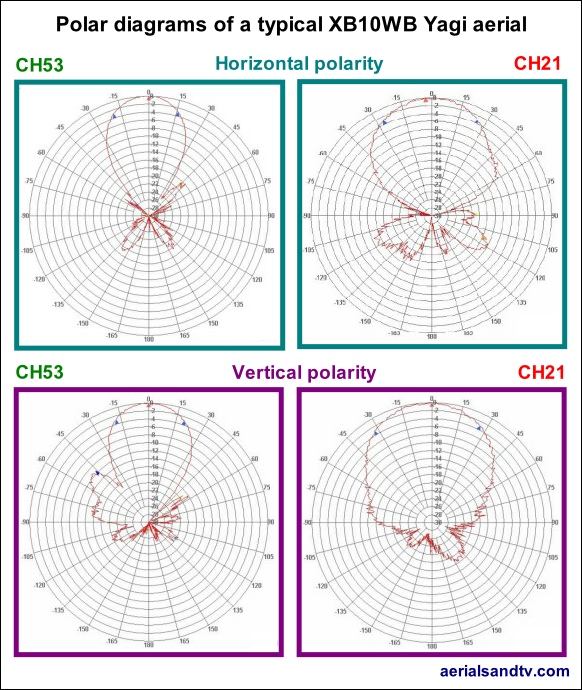
- Wideband aerial polar diagrams
at CH53, CH21 at horizontal and vertical polarity
On this page we have some typical examples of polar response diagrams. Basically a polar diagram indicates the gain of the aerial in any particular direction, which you might have thought was simple enough, rather like gain figures. Unfortunately, just like with (peak) gain figures, there are lies, damn lies, and polar response diagrams...
Why ?
Answers below.....

Well, just as with gain, polar response depends on the frequency ! The gain and polar response/acceptance angle (the latter is taken from the former) will differ for every frequency and the more highly tuned the aerial is the more it will vary according to the frequency.
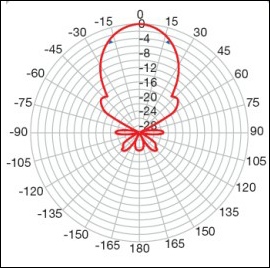
The best example of this are the polar diagrams for the XB14A and XB14 Wideband aerials.
Looking at the polar response diagrams one would be forgiven for thinking, what’s he on about when he says that he doesn’t like wideband Yagi aerials, the wideband has about the same acceptance angle as the more precisely tuned A group ! As it happens the A group has a cleaner tighter polar diagram anyway (the wideband having more side lobes where it would be more likely to pick up off beam transmissions) but, more than that, far more than that, it’s all about the frequency ! The polar response diagram for the wideband will be at its peak frequency (which is probably a channel in the mid 50s) and that isn’t any where near the A group. Down at CH37, and even more so at CH21, its polar response/acceptance angle would look completely different. Really, if manufacturers quote polar diagrams they should (for a wideband aerial) give you 28 of them, one for every frequency (CH21 to CH48) ! Furthermore they should also give the diagrams for the aerial when vertically polarised because they aren’t as tight when vertical. Unfortunately publishing 28 (or 56 ! ) polar diagrams is a little impractical, but, because acceptance angle/polar response is proportional to gain, the gain graph is a good indication of what the acceptance angle would be at any particular frequency. The problem is that many aerial manufacturers don’t supply the gain curves, and even if they do I’m not sure how accurate some of them are....
The two sets of polar diagrams below are slightly different to each other in that those for the simple aerials (at the top) are roughly proportional to each other in terms of gain, whereas the diagrams below them (for the multi element TV aerials) give the polar response drop off in gain relative to the peak gain for the particular aerial, thus explaining why the XB14WB “high gain” appears to have the same gain as a 10 element type!
The top polar diagrams are theoretical, the biggest difference in the real world is that, in a reasonable signal area, you would normally get some response off the end of a horizontally polarised dipole due to interaction of the aerial with the pole and/or signal reflections/cross polarisations. The vertical dipole is drawn as a perfect circle but would lose a small amount of signal is certain directions due to the presence of the pole. Similarly the Omni is drawn as a perfect circle when in actuality it would not be, also note how the circle is smaller than for the vertical dipole alongside due to the Omni’s negative gain characteristic.

These diagrams are obviously simplified and representative (e.g. a horizontal dipole probably would still pick up a a bit of signal off its "end"), but they are still worthwhile for showing the basic principles.
Thanks to Bill Wright for his advice on the difference in polar diagrams between a half wave and full wave vertical dipole.

Note the lack of side lobes on the Log Periodic aerial. Logs may have a fairly wide acceptance angle (i.e. they’re slightly more likely to receive unwanted signals from just “off line” than a high gain Yagi) but they’re actually less likely to pick up unwanted transmissions from behind than a Yagi type aerial. The tightest beam width, and greatest rejection of signals from behind, would be a phased array. On the subject of which.... A Grid aerial is a simple phased array, its polar plot would be similar to the Log Periodic, i.e. relatively wide acceptance angle but high rejection to signals from behind. A properly set up phased array (using two high gain aerials) would have a narrow acceptance angle as well as high rejection of signals from the rear.

Here we have four polar plots of a typical (relatively high gain) XB10WB aerial. All Yagi aerials are designed to "peak" at a particular frequency and for most widebands this is a frequency in the mid CH50s. On the other hand their gain and directivity will be worst at the bottom of the band, i.e. CH21. However, as proved by the adjacent polar plots, a Yagi aerial's polar plot will also vary between horizontal and vertical polarisation !

